If I can’t see latency, token use, and failures on day one, I’m flying blind. This setup connects Azure AI inference to Application Insights and Azure Monitor so I can track request traces, model latency, token counts, errors, and audit-related events from the first call.
Here’s the short version: I connect an Application Insights resource, store the connection string in a secret, wire OpenTelemetry to Azure Monitor, add spans around each inference step, and confirm that every request shows one trace ID with linked logs. That gives me a clean path for debugging, cost checks, and audit review.
What this setup should give me:
- One parent trace for each inference request
- Child spans for retrieval, prompt build, inference, and post-processing
- Key fields like model name, deployment, prompt tokens, completion tokens, and latency
- Linked exceptions with the same operation ID
- Dashboards for p95 latency, token trends, and error rates
- Alerts checked every 15 minutes
- Audit tags like ITAR, CUI, or PII where needed
A simple rule helps here: metrics first, traces second, logs last. I use metrics to spot a spike, traces to find the slow step, and logs to read the error details.
| Signal | What I use it for | First question it answers |
|---|---|---|
| Metrics | Trend and alert checks | Is latency, error rate, or token use going up? |
| Traces | Request-level debugging | Which step slowed down or failed? |
| Logs | Error and audit detail | What exactly happened? |
I also keep one security point front and center: don’t put the Application Insights connection string in code. I store it in Key Vault or my deployment secret store to cut audit and access risk.
If I’m working in AEC, manufacturing, or aerospace, this telemetry is more than monitoring. It becomes the record that shows what model ran, how long it took, how many tokens it used, and whether regulated content was blocked or flagged.
That’s the core idea of the article: set up the pipeline early, trace every inference call, link logs to traces, and verify the data before handoff to production.
Open Telemetry using Console & Application Insights - AI in C# (Microsoft Agent Framework)
Prepare Azure Monitor and the OpenTelemetry pipeline
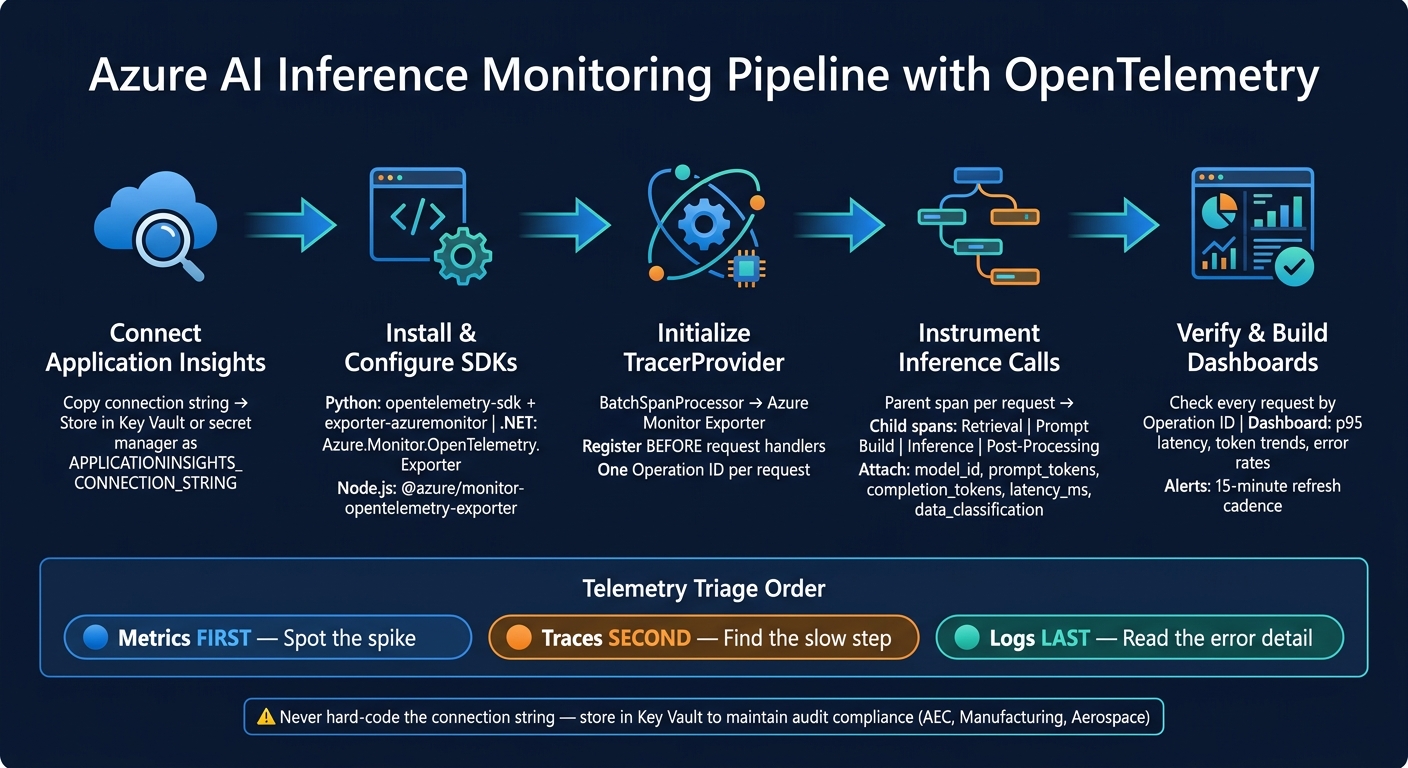
Azure AI Inference Monitoring Pipeline with OpenTelemetry
Set up Azure Monitor and OpenTelemetry early so inference traces, latency, token use, and errors start exporting from the first request.
Create or connect Application Insights for the Azure AI project
Open your Azure AI Foundry project in the Azure portal, then go to Monitoring or Tracing. From there, either create a new Application Insights resource or connect one you already have.
After the connection is in place, copy the connection string from the Application Insights Overview blade. Use that connection string instead of the legacy instrumentation key.[3] Store it in an environment variable named APPLICATIONINSIGHTS_CONNECTION_STRING, then load it at runtime through Azure Key Vault or your deployment pipeline’s secret manager. Hard-coding it in source code creates avoidable compliance risk, especially for AEC, manufacturing, and aerospace teams that need clean audit trails.
Before you add instrumentation, do a quick check. Send a small test prompt through Azure AI Studio’s playground, then look in Live Metrics or Transaction search in Application Insights. If nothing shows up, double-check the diagnostic settings and make sure the resource ID, subscription, and region all match.
Once Application Insights is connected, the next step is to instrument the app so every inference call shows up as a correlated trace.
Install SDKs and configure the tracer provider
Start by installing the OpenTelemetry packages for your runtime.
- For Python:
opentelemetry-sdk,opentelemetry-api, andopentelemetry-exporter-azuremonitor - For .NET:
Azure.Monitor.OpenTelemetry.Exporter, wired in withAddOpenTelemetry()andAddAzureMonitorTraceExporter() - For Node.js:
@opentelemetry/sdk-trace-nodeand@azure/monitor-opentelemetry-exporter
It’s smart to pin versions in your dependency file so security fixes don’t disrupt observability. This practice aligns with broader AI governance for regulated industries where traceability is paramount.
At startup, initialize the global TracerProvider with a BatchSpanProcessor that points to the Azure Monitor exporter. Register instrumentation before request handlers or inference clients start. That way, each request and model call shares one operation ID in Application Insights. Also, keep the TracerProvider alive for the full process lifetime.[4][5][6][7]
Next, attach spans to the model call so latency, token use, and failures flow into Azure Monitor.
Instrument Azure AI inference calls for traces, latency, and token use
Instrument every inference call so Azure Monitor can split out latency, cost, and failures.
Trace the full inference request path
Give each request one parent span, then add child spans for retrieval, prompt building, inference, and post-processing. In plain English: wrap the top-level handler in a request span, then create a child span for each downstream step.
Use a single trace ID across the full path so you can see exactly where delay begins. Once those spans are live, check them in Application Insights and turn that data into dashboards.
Add attributes that make traces useful in production
Only attach fields you’ll query in Azure Monitor. If you dump in too much metadata, traces get noisy fast.
model_iddeployment_nameprompt_tokenscompletion_tokenslatency_mstime_to_first_tokensession_idtenant_iddata_classificationerror_typeexception_message
For AEC and aerospace workloads, tag spans with data_classification so regulated content stays visible in audit trails.[1]
Capture logs and exceptions with trace correlation
When an inference call fails, record the exception on the active span and set the span status to ERROR. That keeps the failure tied to the trace, which makes it much easier to investigate in Azure Monitor without jumping between separate log queries.
This instrumentation layer makes each model call explainable and each failure traceable.
Verify telemetry and build Azure Monitor views
Check traces and logs in Application Insights
Once traces and logs are flowing, make sure every request can be found by operation ID in Application Insights. Each inference request should show a trace ID, latency, token fields, and a linked exception log. You should also be able to spot blocked requests - like CUI detection blocks and PII warnings - tied to that same operation ID.[1][2]
If token or usage data is missing, start with the model routing logic and API response parsing. That data should show which model handled the request and whether token fields were recorded. If a request has no token data or no linked log entry, fix the instrumentation before you build dashboards.
For regulated workloads, telemetry should also include ITAR/CUI data classification and automated audit trails.[1][8]
Build Azure Monitor dashboards for latency, token trends, and errors
In Azure Monitor, build dashboards around p95 latency, token volume by deployment or workflow, and error rate by request type. If you’re working with compliance-heavy workloads, add compliance-event counts for CUI/PII blocks so regulated content stays visible in audit trails.[1][2]
Set a 15-minute refresh and alert check. That way, you can catch telemetry gaps early instead of finding them after the fact.
When to use traces, logs, and metrics
Each signal has its own job. The easiest path is simple: start broad, then drill down.
| Telemetry type | Best used for | When to inspect it |
|---|---|---|
| Metrics | Trend monitoring and alerts | First - check when an alert fires to see whether latency, error rate, or token usage is trending up |
| Traces | Request-level debugging and bottleneck identification | Second - open the trace to isolate which step in the inference path failed or slowed |
| Logs | Exception detail and compliance events | Last - review the linked log to read the exception or confirm a blocked request [2] |
Start with metrics, then open the trace, then check the linked log.
Use these views as your baseline for alerting and ownership in production.
Hand off to production monitoring and next steps
Set alerting, ownership, and review cadence
Once traces, logs, and dashboards are working, the next move is ownership.
After telemetry is verified, assign owners and set alert thresholds before go-live. Then plan a 30-day hypercare period after go-live to fine-tune thresholds and document architecture diagrams, runbooks, and troubleshooting guides before handoff [1].
Use hypercare to tighten thresholds and make it clear who responds to what.
Here’s a simple ownership map for production:
| Production Checklist Item | Responsible Party | Signal |
|---|---|---|
| Verify full request path and end-to-end visibility | IT / DevOps | Traces |
| Set real-time alerts for outages or spikes | Operations | Latency |
| Review weekly token usage trends for cost and routing | Model Owners | Token trends |
| Correlate exceptions with trace IDs for rapid debugging | IT / Engineering | Exception correlation |
| Audit CUI/PII detection and access logs | Compliance / Security | Compliance logs |
After that, telemetry becomes part of day-to-day operations.
Key takeaways for AEC, manufacturing, and aerospace teams
The implementation follows five steps: connect Application Insights to your Azure AI project, configure the OpenTelemetry tracer provider, instrument inference calls to log latency and token usage, correlate logs and exceptions to trace IDs, and verify everything in Azure Monitor before handoff.
For AEC, manufacturing, and aerospace teams, telemetry acts as the audit trail. It shows whether CUI was blocked, how long requests took, and whether the system stayed within acceptable operating bounds. That’s what makes AI usable in regulated and production settings [1][2].
FAQs
How do I verify trace correlation is working?
Check that your OpenTelemetry setup passes the trace context header all the way across your app components and Azure AI Inference.
In Azure Monitor through Application Insights, make sure the trace ID stays the same from your application to the Quanta gateway. Also check that operation IDs line up across dependencies. That confirms end-to-end trace correlation.
Which span attributes matter most in production?
Focus on span attributes that reflect performance, cost, and reliability. That means duration for latency, input and output token counts for cost and throughput, and cache usage for model efficiency.
You should also log error categories, like internal failures and tool-specific errors, along with tool execution outcomes. Put together, these details give teams the context they need to troubleshoot bottlenecks and keep high-throughput enterprise operations stable.
What should I alert on first in Azure Monitor?
Start with alerts for data quality, compliance guardrails, and system reliability.
That usually means watching for a few things right away:
- Data quality issues like missing values or unexpected formats
- Compliance alerts for CUI and real-time warnings for PII
- Production anomalies and latency thresholds to catch performance issues early