Free trial abuse can burn through millions of tokens and leave you with a $0 return. If I had to sum up the fix in one line, it’s this: I’d watch for odd usage, linked accounts, risky session behavior, machine-like request speed, and repeat failure loops - then back those checks with hard budgets and human review.
Here’s the short version:
- Anomaly detection spots trial activity that doesn’t match normal use.
- Identity clustering links accounts that seem tied to the same person, device, or network.
- Behavior scoring checks whether a session is acting like normal use or abuse.
- Velocity checks look for request timing that feels too fast for a person.
- Pattern matching finds repeat loops that waste compute without reaching a valid result.
A few points stand out to me:
- In usage-based AI, every request costs money.
- Some sessions can consume millions of tokens in a single trial.
- Abuse can also hurt paying users by pushing shared systems into limits or slowdowns.
- No single signal is enough on its own. The best results come from stacking signals together.
- Human review still matters for gray areas like shared office IPs, school networks, or large team evaluations.
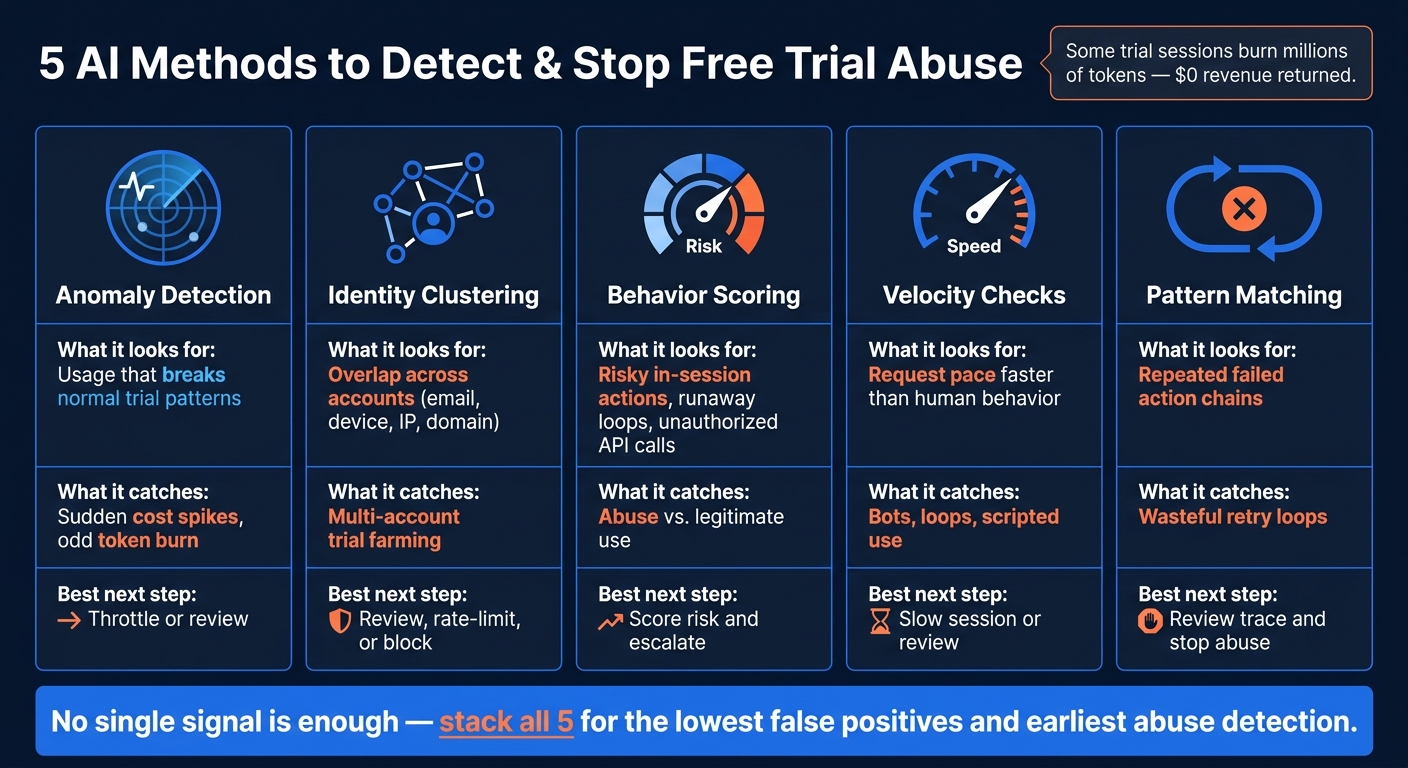
5 AI Methods to Detect & Stop Free Trial Abuse
If There’s Free Compute, There’s Abuse - Fighting Fraud with Lightweight LLM Agents// Jonas Scholz
Quick Comparison
| Method | What it looks for | What it helps catch | Best next step |
|---|---|---|---|
| Anomaly detection | Usage that breaks normal trial patterns | Sudden cost spikes, odd token burn | Throttle or review |
| Identity clustering | Overlap across accounts | Multi-account trial farming | Review, rate-limit, or block |
| Behavior scoring | Risky in-session actions | Runaway use, internal API misuse | Score risk and escalate |
| Velocity checks | Request pace | Bots, loops, scripted use | Slow session or review |
| Pattern matching | Repeated failed action chains | Wasteful retry loops | Review trace and stop abuse |
If I were setting this up, I’d treat these five checks as one system, not five separate rules. That keeps false alarms lower while helping teams stop abuse before trial costs get out of hand.
Why Free Trial Abuse Costs Money in Usage-Metered Products
In usage-metered AI, abuse gets expensive fast. Every request uses compute, and reasoning models use even more.
It gets worse with autonomous agents. A single runaway loop can wipe out a trial budget overnight.
Some abusive sessions burn through millions of tokens and bring in $0 in revenue.
This hits hardest in AEC, manufacturing, and aerospace. Trial access in these fields often includes tools with steep per-session costs. Think vision AI for drawing reviews, OCR parsing for long contracts, compliance checks against regulatory documents, or production scheduling with constraints built in.
And there’s a knock-on effect. When bad actors chew through shared infrastructure, real users can run into rate limits or other service issues.
| AI Use Case | Sector | High-Cost Driver | Abuse Risk |
|---|---|---|---|
| Spec & Drawing Review | AEC | Vision AI and long-context models | High compute cost; professional liability |
| Production Scheduling | Manufacturing | Complex constraint optimization | Infrastructure demand; noisy pricing data |
| Contract Intelligence | Manufacturing | OCR and 40-page PDF parsing | Unbilled API costs; data leakage |
| Compliance Monitoring | Aerospace | Regulatory document reasoning | CUI/PII exposure; high marginal cost |
| Supply Chain Response | Manufacturing | Multi-source ingestion | Runaway loops; inflated infrastructure demand |
These cost spikes are often the first thing anomaly detection picks up.
1. Anomaly Detection
Anomaly detection watches trial sessions for behavior that drifts away from normal trial baselines. In plain English: it compares what’s happening right now against what a normal trial session usually looks like.
The strongest checks look at five signal types together:
- Usage signals, such as token consumption, iteration count, and session length
- Device signals, such as browser fingerprints and CAPTCHA hits
- Identity signals
- Billing signals
- Governance signals
When several of those signals jump at the same time, the system raises a flag.
It also helps to convert tokens into human-scale units so operators can spot odd burn rates fast. A giant token number on its own can be hard to read. Turn it into something people can scan in a few seconds, and unusual usage stands out.
At 80% to 90% of budget, a graceful handoff can save partial results and report progress before the budget cap hits. That matters because false positives still happen, especially during normal onboarding or testing. And if one account looks fine on its own, but many accounts share the same footprint, identity clustering is the next check that can catch it.
2. Identity Clustering
When anomaly detection flags one account, identity clustering looks for the bigger pattern.
Here’s the idea: a single trial signup may look fine on its own, but a group of similar signups can tell a very different story. If several accounts appear tied to the same person, device, or network, clustering helps surface that pattern.
The system compares signals like:
- email patterns
- device fingerprints
- IP ranges
- browser traits
- company domain data
When several of those signals overlap across separate accounts, the system groups them into a cluster and raises a flag. Identity integrations can also compare assigned seats with actual usage. From there, the response should match the confidence level.
This is where things get tricky. Not every cluster points to abuse. VPN users, coworking spaces, university networks, large enterprises, families, and valid multi-user teams can share the same IP range or device profile for perfectly normal reasons. So the response has to fit the situation.
If a cluster hits a hard violation - like an attempt to bypass security governance or push past a hard budget cap - an auto-block makes sense. If the signals are less clear, rate-limiting can slow activity without cutting off access right away. That gives the system room to react without overcorrecting.
| Action Level | Trigger Condition | Outcome |
|---|---|---|
| Auto-Block | Hard violations, such as attempts to bypass security governance or hit a hard budget cap | Immediate termination of session; access revoked [3][4] |
| Rate-Limit | Usage approaching the budget cap [4][1] | Switch to a graceful exit; save partial results; notify admin |
| Human Review | Ambiguous cluster signals, such as shared IPs or university networks | Manual final decision before any action is taken |
3. Behavior Scoring
Behavior scoring looks at session behavior, not just account identity.
It gives each session a live risk score that shifts as activity unfolds. Once identity has been grouped, behavior scoring helps answer the next question: is this account acting like normal use, or abuse?
The main signals the AI watches include usage volume, session duration, iteration counts, and unauthorized internal API calls or data-changing actions. A runaway loop, rapid iteration, or heavy API use outside normal trial behavior is a strong sign of abuse.
What makes behavior scoring smarter than a basic usage cap is semantic goal evaluation. The AI doesn’t just count how many times someone took an action. It checks whether that activity is leading to a valid result. If a user keeps repeating the same expensive action without reaching a valid result, the system flags that pattern as abuse [4][1].
For gray-area cases, bring in human review. Auto-blocks should be saved for clear policy violations, such as unauthorized internal API calls or data-changing actions the user was never allowed to run. If the same pattern repeats in a short burst of activity, velocity checks add another layer of confidence.
4. Velocity Checks
Velocity checks flag activity that looks normal on the surface but moves at a pace that doesn’t fit human behavior. Behavior scoring looks at intent. Velocity checks look at speed.
Good systems put firm caps on budget, iteration count, and session length. They also track the time between requests so they can spot automation that moves faster than a person likely would. Those hard limits matter because they sit outside the agent’s own judgment. In plain English: speed becomes its own signal, separate from total usage.
This helps catch sessions that burn through actions too fast to seem credible, even when total spend still appears normal. A user doing heavy but legitimate work may rack up a lot of activity. A runaway loop often shows up in the pace. That’s why velocity checks work best when paired with behavior scoring.
If speed alone doesn’t settle the call, send the case to review.
And when a takeover trigger fires or the budget is exhausted, route the case to human review to confirm the task and decide whether to re-arm the budget.
5. Abuse Pattern Matching
After speed, the model looks at pattern. Abuse pattern matching focuses on what a session is doing, not just how fast it moves. It checks the sequence of actions and the intent behind each step, not only the raw count or pace.
The model can spot repeated failure loops, where an agent keeps trying the same failed action without making progress [4][2]. A velocity check may let that keep going until the resource limit runs out. The hardest false positives usually come from legitimate power users and vague goals. A researcher working through a hard task can look a lot like an abuse script, and a broad objective can make a session appear stuck even when it isn’t [1].
When confidence is low, send the session to human review with the action trace and outcome summary. Paired with the earlier signals, pattern matching helps tell the difference between heavy legitimate use and repeated abuse.
How These Signals Work Together
No single signal tells the whole story.
The clearest risk signal shows up when several indicators line up in the same account or session. These five checks are at their strongest when they back each other up. That’s why it makes more sense to treat them as a stack, not as separate rules.
For example, a cluster of signals like rapid iterations, no enforced budget cap, and immediate use of expensive reasoning models paints a much clearer picture of risk than any single flag on its own. Looking at the full stack helps cut false positives and spot abuse earlier.
It also lets teams respond in proportion to what they see. Instead of reacting to one trigger, they can:
- slow a session
- ask for more information
- block access outright
And when the signals point in different directions, human review makes the final call.
Use layered signals to slow, review, or stop abuse before it drains budget.
Where Human Review Still Matters
The five signals are good for ranking risk fast. But edge cases still need a human call. Even strong signals can misread normal behavior, so some decisions shouldn’t be left to the system alone.
Shared corporate IPs, conference-driven signup spikes, and heavy but allowed enterprise evaluations can all set off alerts without pointing to abuse. The smart move is to use AI signals as a review queue, not a final verdict.
When risk goes up but the case still isn’t clear, send it into a human takeover flow. If an account gets close to its trial limit, move it into that flow: save partial results, alert a reviewer, and let a human decide whether to throttle, extend, or restrict access. Budgets, checkpoints, and takeover rules help keep risky sessions from running past the limit.
If the system detects PII or other sensitive compliance data, hard-stop the session and route it to governance or legal review.
Use a simple decision matrix for the edge cases that come up most often.
| Scenario | AI Signal | Required Action |
|---|---|---|
| Shared corporate IP, multiple users | Identity clustering flag | Review - confirm enterprise evaluation context |
| Conference-driven signup spike | Velocity alert | Review - verify timing and intent |
| Heavy but permitted enterprise evaluation | Usage near trial limit | Trigger takeover flow - throttle, extend, or restrict access as needed |
| PII or sensitive data detected in prompts | Compliance trigger | Hard-stop and route to governance or legal review [3] |
These calls depend on clear data, logs, and policy rules.
Data and Governance Requirements for Production Teams
The five detection methods only work when the data underneath them is solid. Telemetry, identity, and cost data are the raw inputs that make abuse detection dependable. If those inputs are messy or incomplete, even strong AI signals turn into noise instead of flags a team can act on.
For those flags to mean anything, telemetry has to be complete and connected to cost, identity, and session data. At a minimum, production teams need:
- Time-stamped usage logs for every API call and model interaction
- Identity and session telemetry tied to a verified identity provider with SSO and RBAC
- Device and network signals that show where requests originate
- Quota and budget event data tracked against hard ceilings rather than rough estimates
- Billing metadata that maps consumption to specific models and cost tiers
These feeds make the five signals audit-ready and explainable.
Once teams collect the signals, governance decides whether reviewers can trust them and do something with them. Logs need to be append-only, easy to review, and tied to individual sessions, not just rolled-up dashboards. That last part matters. An aggregate chart can show that spending jumped, but it usually can’t show who did what, when, and from where.
For industries with strict compliance requirements, use hard-stop detection for CUI and PII to keep sensitive data out of the review queue. If that kind of stop isn’t required, log the event and route it for review instead. Budget data should also be shown in human-readable units so non-technical reviewers can understand consumption fast, without digging through token math. Ryshe’s delivery team uses human-readable units: 1 page = 1,000 tokens, 1 book = 200 pages, and 1 shelf = 20 books [4][1].
For AEC, manufacturing, and aerospace organizations, Ryshe’s Quanta enterprise AI context gateway provides policy enforcement, full observability, automated audit trails, and intelligent model routing across models, so abuse flags stay explainable and reviewable [3].
With the data foundation in place, teams can apply the five signals in a consistent way across sessions and accounts.
Conclusion
These five signals work best when you use them together, not one by one. Anomaly detection, identity clustering, behavior scoring, velocity checks, and abuse pattern matching each spot a different kind of abuse.
They work even better when you pair them with hard budgets and takeover triggers. Automation handles the heavy load. Human review steps in for edge cases and policy decisions.
The aim is simple: a cost-controlled program that’s hard to game and easy to escalate to people when needed. That balance helps keep trial access open for legitimate users while keeping abuse in check.
FAQs
How do you reduce false positives?
Cut false positives by pairing automated checks with human review. When a case sits in a gray area, send it to the right subject matter expert instead of forcing a yes-or-no call.
Keep master data clean. Make authority lines clear, too, so people can review the full context and override AI flags when edge cases show up.
When should a human review a flagged trial?
AI handles routine patterns and high-volume traffic well, but human review still matters for edge cases and policy calls that aren’t black and white.
People should step in when a trial gets flagged and the behavior is unclear, the stakes are high, or the system may have read the rules the wrong way. That human check helps sort out gray areas where the automated system doesn’t have enough business context or the authority to reverse a decision.
What data do you need to detect trial abuse?
You need telemetry that tracks both who the user is and how they behave.
That usually includes:
- User identifiers and account attributes
- Session metadata
- Behavioral signals, such as resource use, access frequency, and interaction patterns
- Specific user actions
This gives AI enough context to flag anomaly patterns, velocity issues, identity clustering, and known abuse signatures. And when something sits in a gray area, it can route that case to human review.
Think of it this way: identity data tells you who showed up. Activity data helps show what they did once they got in. You need both. Without that full picture, it’s much harder to spot abuse that looks normal on the surface.