If I run APIs in Azure API Management, I need four things in place from day one: logs, metrics, traces, and alerts. Without them, a slow backend, a spike in 5xx errors, or an AI loop that burns through budget can keep running longer than it should.
Here’s the short version:
- I send GatewayLogs to a place I can query, usually Log Analytics
- I watch request volume, failed requests, average latency, and P95 latency
- I pass one correlation ID through APIM, backend services, and Application Insights
- I alert on traffic spikes, throttling, latency drift, and budget limits
- I keep runbooks, handoff steps, and resume points ready before an incident starts
In other words: observability is how I tell the difference between one bad request, a service-wide problem, and a loop that needs to stop now.
A few numbers matter most here:
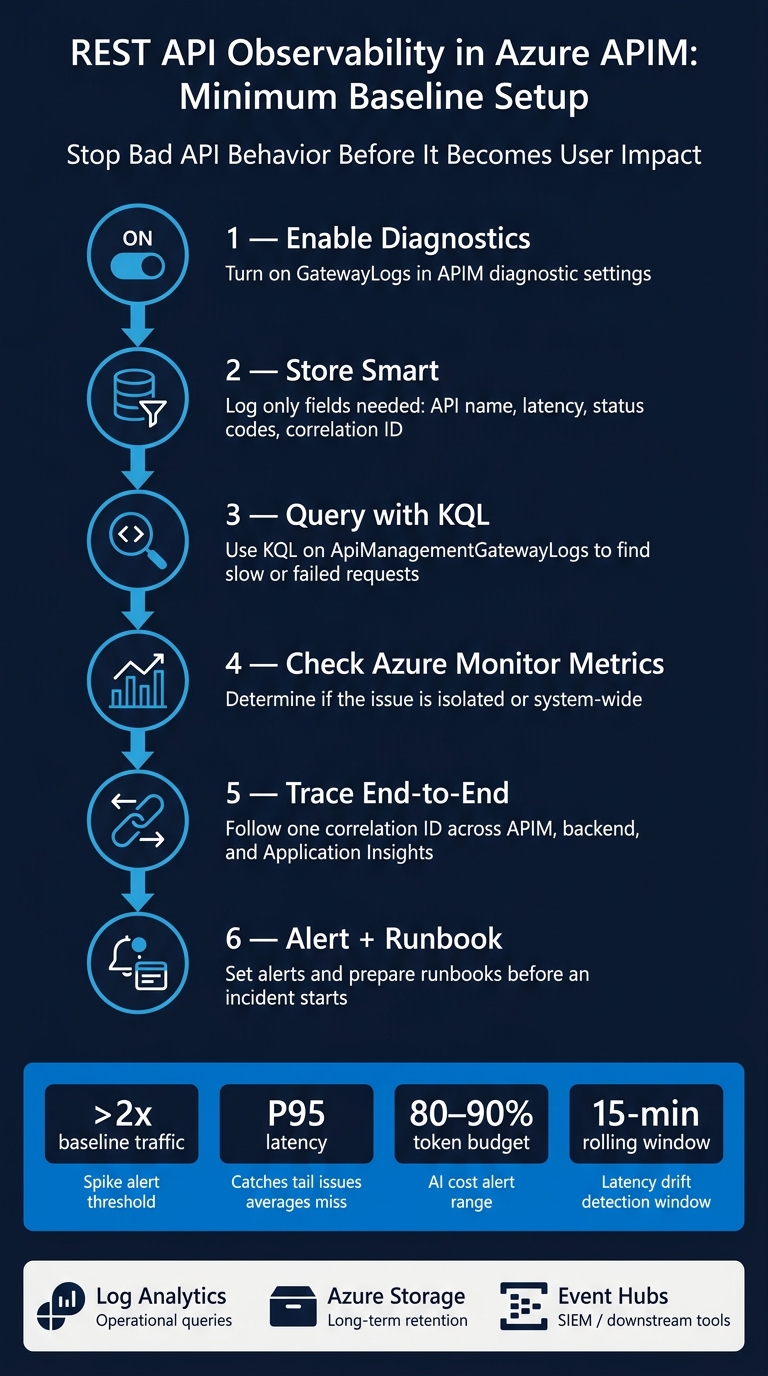
- >2x baseline traffic can point to abuse, bad client behavior, or looped automation
- P95 latency shows slow requests that averages can hide
- 80% to 90% of token budget is a good alert range for AI-backed flows
- A 15-minute rolling window helps spot latency drift before users feel a larger impact
I’d keep the setup simple:
- Turn on diagnostics in APIM
- Store only the fields I need for failures and latency checks
- Use KQL to find slow or failed requests by API, status code, or correlation ID
- Check Azure Monitor metrics to see if the issue is isolated or broad
- Trace the request end to end in Application Insights
- Use alerts and runbooks so the team knows what to do next
If I had to boil the whole article down to one point, it would be this: good observability helps me stop bad API behavior before it turns into user impact, wasted calls, or extra cost.
REST API Observability in Azure API Management: 6-Step Setup Guide
How API Monitoring in APIM is changing the game | APIM Series Part 19
Collect API Traffic Data from Azure API Management
Start by picking the log destination. That choice affects how fast teams can dig into production AI and automation incidents, and how long the data stays around. These logs also help teams stop runaway automation before it burns time, budget, or API quotas. In plain terms, this raw traffic data is the starting point for latency checks, error review, and request tracing.
Enable Diagnostic Settings and Choose Log Destinations
Set diagnostic settings at either the APIM service level or the API level. For production traffic, use GatewayLogs.
Each destination has its own job:
| Destination | Best For | Notes |
|---|---|---|
| Log Analytics | Immediate operational support and incident investigation | Supports KQL queries |
| Azure Storage | Long-term retention and compliance | Useful for archival storage |
| Event Hubs | Streaming logs to SIEM tools or downstream tools | Useful when another system consumes the data |
After that, log only the fields that help with incident review and trend analysis. More data isn’t always better. If a field never helps answer “what broke?” or “why was this slow?”, it’s probably noise.
Log the Fields Needed for Volume, Latency, and Error Analysis
Keep the logging focused on the fields that matter for volume, latency, and error analysis: API name, operation name, client identity, request ID, latency, backend latency, status codes and repeated failures, and quota or rate-limit events.
Capture request parameters only when they make debugging easier in a meaningful way. And before storing logged bodies, redact secrets and credentials. That’s one of those small setup steps that can save a lot of pain later.
Use KQL to Investigate Production Issues
Query ApiManagementGatewayLogs in Log Analytics with KQL. Start with TimeGenerated, then narrow in on failed or slow requests by API, operation, status code, or CorrelationId.
CorrelationId is the thread you can follow across gateway and backend logs. If you’re trying to piece together what happened in production, that single field can do a lot of the heavy lifting. It also helps to split total request duration from backend latency, because that shows whether the slowdown starts in the gateway or in a downstream service.
Use these queries to find patterns, then check those patterns against metrics and dashboards.
Monitor Metrics, Dashboards, and Service Health
Once logs show the failure pattern, metrics tell you what kind of problem you’re dealing with. Is it one bad request? A growing issue? Or a platform-level event? After KQL isolates a failed request, use metrics to figure out whether the problem is local or system-wide.
For a cleaner view of service health, pair Azure API Management metrics with Azure Service Health and workload-specific indicators. That makes it much easier to tell the difference between a platform incident and an app issue.
Track the Metrics That Matter in Azure Monitor
For AI-backed workflows, keep a close eye on request volume, failures, latency, token usage, and iteration count. Those signals help you spot runaway behavior before it gets expensive or disruptive.
This metric table connects straight to the logs section. KQL can surface a single-request failure. Metrics show whether the same problem is hitting the system at scale.
| Metric | What It Indicates | When to Alert |
|---|---|---|
| Total Requests | Traffic volume and usage trends | Sudden spikes (>2x baseline) or drops to zero |
| Failed Requests | API reliability and error rates | Any sustained increase in 5xx or 4xx errors |
| Success Rate | Overall service availability | Drop below the SLA target |
| Throttled Calls | Capacity limits or potential DDoS | Repeated or sustained throttling above baseline |
| Average Latency | General responsiveness | Increase of >20% over a 15-minute rolling window |
| P95 Latency | Slowest 5% of requests | P95 exceeds the latency SLO |
| Token Usage | AI cost control, tracked by the AI workflow in Azure Monitor | When usage reaches 80% of the defined limit |
| Iteration Count | Runaway loop detection, tracked by the AI workflow in Azure Monitor | When an agent exceeds the max-iteration ceiling |
Watch P95 latency on its own. Average latency can look fine while a small slice of requests gets much slower. That’s how tail issues slip past teams.
Use these signals to decide what belongs on a dashboard and what should trigger an alert.
Build Dashboards for Operations and Leadership Visibility
Use two dashboards. One should serve engineering, with anomaly signals, error codes, and latency breakdowns. The other should serve leadership, with SLA/SLO status, availability, and service-health trends. Same system, different view.
That role-based split cuts noise. Operators can focus on triage, while leaders get a clean read on service status.
| Metric Category | Engineering View | Leadership View |
|---|---|---|
| Health | Real-time anomaly alerts, error rates, and API status | SLA/SLO status and overall service availability |
| Performance | Latency, P95 trends, and throttling | Request volume and success rate |
| Trends | Root-cause analysis and investigation logs | Traffic growth and service-health trends |
Keep leadership dashboards centered on one question: is the system healthy?
Trace Requests End to End with Request IDs and Application Insights
Dashboards and metrics tell you something failed. Request tracing tells you where it failed.
That’s the difference between guessing and knowing. Once you can follow the same correlation ID across each hop, the next move gets a lot simpler.
Set and Propagate Correlation IDs Across Services
Use one correlation ID across APIM, backend services, and Application Insights. That single thread lets you follow a request from start to finish instead of piecing the story together after the fact.
Before storing traces, redact secrets and PII [1].
Use Request Tracing and Application Insights for Root-Cause Analysis
Use traces to enforce token limits, iteration caps, and checkpoints that stop runaway behavior [1]. If a request goes off the rails, traces help you spot the bad hop fast.
Then keep those same limits in place for the next run, so you’re not starting from scratch each time. Those same trace fields also feed the alerts and runbooks in the next section.
Set Alerts, Define Runbooks, and Run Observability in Production
Trace data and dashboards only matter when they lead to action. This section is about closing that loop.
Create Actionable Alerts for Latency, Failures, and Traffic Anomalies
Use the latency, error, and traffic signals from the earlier sections to trigger action, not just visibility.
For production REST APIs, start with alerts that protect latency, budget, and traffic behavior.
The first alerts to set up are:
- Latency breaches: Watch for P95 duration getting close to your ceiling.
- Budget or cost thresholds: Alert when token usage hits 80% to 90% of the allowed limit [1].
- Traffic anomalies: Flag rate-limit pressure or sudden traffic spikes.
For AI-driven REST flows, set up a takeover path before the limit hits. That gives the system time to save state, finish cleanly, and report where it stopped.
Treat LLM-based stop conditions as advisory only. Always keep a deterministic ceiling underneath them - hard iteration and token limits that fire no matter what the model outputs [1]. That keeps alerting predictable and helps prevent runaway loops.
Use Runbooks to Respond Faster and Reduce Repeat Incidents
Once an alert fires, the runbook should turn that signal into a fixed response.
An alert without a runbook is just noise. A runbook turns a triggered alert into a repeatable response.
At a minimum, the runbook should tell responders how to save state, report missing data, and resume from the last checkpoint. If a human needs to step in, the same pattern still works: inspect the state, continue from the last safe point, and keep the process moving without losing work.
After the incident, retune the threshold, severity, and escalation rule to cut alert fatigue.
Conclusion: The Minimum Observability Baseline for Azure API Management
If you’re running REST APIs in production - especially for AI or automation flows - observability isn’t optional. The minimum baseline looks like this:
| Capability | What It Covers |
|---|---|
| Latency and budget alerts | Early warning before duration or token ceilings are reached |
| Traffic anomaly alerts | Rate-limit pressure or sudden bursts that need immediate action |
| Handoff paths | Clean wrap-up before a hard stop |
| Resume points | Resume work from the last safe state |
| Runbooks | Repeatable incident response and escalation |
Every item in that table makes the system more predictable when things get messy. With alerts, runbooks, and resume points in place, you can recover without guessing.
FAQs
How much APIM data should I log?
Log enough APIM data to keep a clear view of what’s happening without piling up storage costs. In most cases, metadata and performance metrics are enough. That means logging request timestamps, endpoint paths, status codes, latency, and token usage for AI models instead of storing full request bodies.
For audit trails, set retention policies that put firm limits on message count and record age. For example, you might keep 100,000 messages or retain data for 90 hours. Before you lock in your logging settings, review your data volume and what your team needs from those logs.
How do I trace one request end to end?
Use request IDs and audit logs to track activity across your infrastructure. Pull audit records like MsgProxyRequestAudit to follow a request from start to finish, including pane ID, endpoint, status, and token usage.
For more complex flows, create and pass a unique request ID from the entry point. That gives you a simple way to filter logs and metrics across services and see what happened, where, and when.
Ryshe’s Quanta enterprise AI context gateway supports centralized governance and request tracing for AI and automation workflows.
What alerts should I set up first?
Start with alerts for data quality and system anomalies. Keep an eye on missing values, odd data formats, and late arrivals so you can spot problems early, before they spread.
It also helps to alert on tool errors and latency metrics. That gives you real-time visibility into slowdowns, bottlenecks, or failures in your API integrations.
The goal is simple: move from reactive monitoring to a more proactive approach in production.