Predictive maintenance on Azure works best when I keep it simple: pick one machine, one failure mode, and one alert that leads to a work order. The article shows a clear path from sensor data to action in ERP, MES, and service records, with data quality at the center. It also shows why this matters: one manufacturer cut defects from 4.2% to 1.1% and saved $720,000 per year, while another improved field accuracy from 68% to 97.2% and cut scrap by $420,000 per year.
If I boil the article down, it says this:
- Start small. Don’t model every asset at once.
- Fix data first. Bad IDs, weak logs, and missing timestamps lead to bad alerts.
- Use Azure as the flow layer. Ingest data, score risk, show alerts, and route action.
- Send alerts into plant systems. A dashboard alone does not stop downtime.
- Track business results. Watch downtime, MTBF, MTTR, scrap, parts use, and alert follow-through.
- Scale only after the first line works. Standard field names, audit trails, and access rules matter.
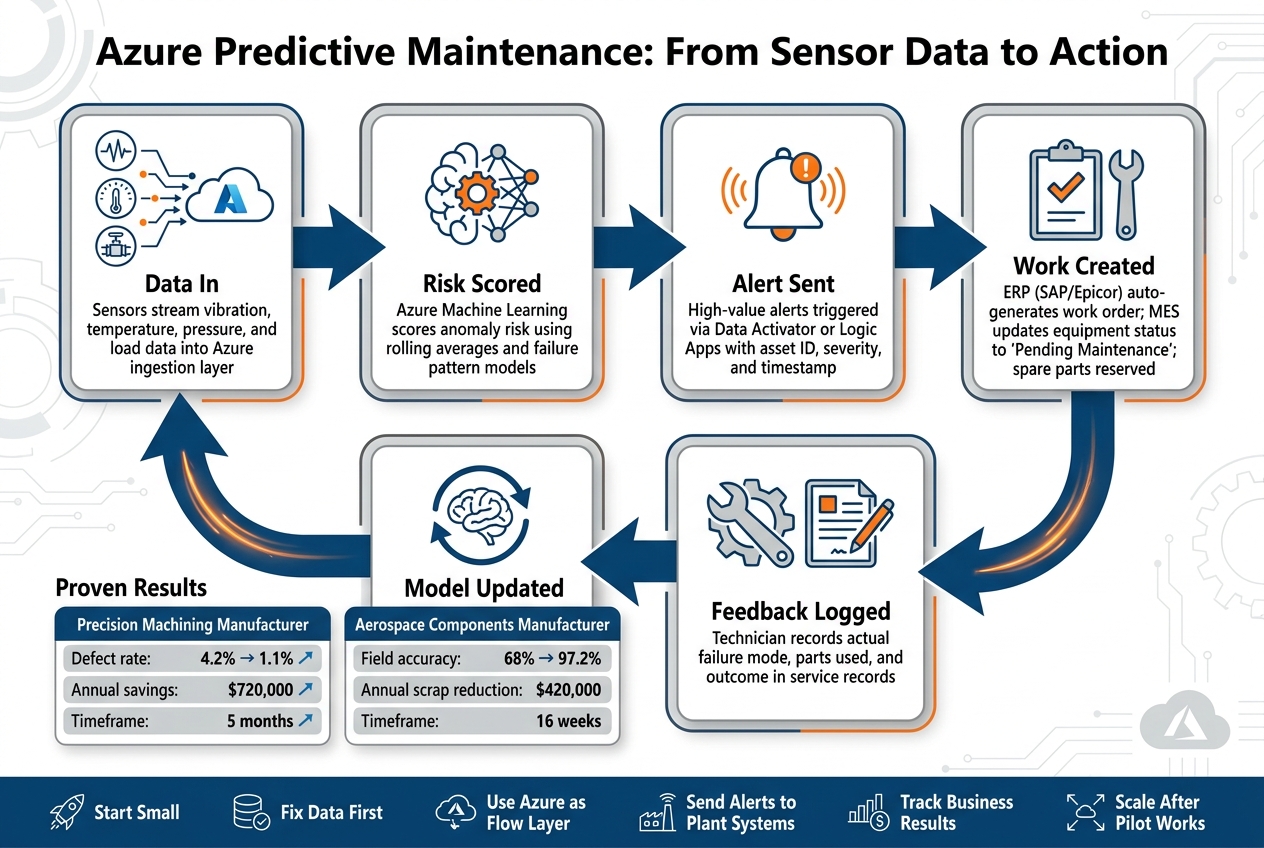
I also see a simple pattern in the article: data in, risk scored, alert sent, work created, feedback logged, model updated. That closed loop is the whole point. If I can’t tie an alert to a machine, a work order, and an outcome, the system is not doing much.
Here are the main moving parts at a glance:
| Step | What happens |
|---|---|
| Choose the use case | Pick one asset with high downtime cost, repeat failures, long part lead times, and usable data |
| Prepare the data | Standardize asset IDs, sensor feeds, and maintenance logs |
| Build the Azure flow | Use Azure services for ingestion, storage, scoring, alerts, and dashboards |
| Trigger action | Send high-value alerts to ERP, MES, and service records |
| Measure results | Track downtime, scrap, repair time, and whether alerts led to work |
| Expand carefully | Reuse shared fields, model tracking, and access controls across plants |
In short, the article is not about AI for its own sake. It’s about using Azure to turn machine signals into clear maintenance action that cuts downtime, scrap, and rush repairs.
Azure Predictive Maintenance: From Sensor Data to Action
Manufacturing Predictive Maintenance Project using Azure Databricks | ADF | Power BI
Pick the right equipment, sensors, and failure modes first
The fastest way to derail a predictive maintenance program is trying to model everything at the same time. Start with a staged roadmap: one asset class, one failure mode.
That does two things right away. It makes the project specific, and it forces the team to answer the questions that matter: What data do we already have? What does failure look like in the signals? And when an alert fires, what exactly should someone do next?
Your first target should be the asset with the clearest sensor signal, the highest cost of downtime, and the simplest response when an alert appears. Once that use case is nailed down, you can map the signal path, scoring step, and alert threshold in Azure.
Common plant problems predictive maintenance can detect
On many U.S. plant floors, the highest-cost failure modes tend to show up in a small set of asset categories. The table below links common equipment to the sensor signals that flag trouble early, along with the business impact when those issues slip by.
| Asset Category | Common Sensor Types | Failure Indicators | Business Impact |
|---|---|---|---|
| CNC Machines | Vibration, tool wear, motor load | Spindle bearing wear, dimensional drift, overheating | High scrap costs, unplanned downtime |
| Pumps & Compressors | Pressure (psi), vibration, temperature (°F) | Cavitation, seal failure above 180°F, air leaks | Line stoppages, wasted energy |
| Conveyors & Motors | Electrical load, vibration, cycle count | Misalignment, belt slip, motor burnout | Throughput loss, safety risks |
| Ovens & Presses | Temperature (°F), pressure (psi) | Overheating, hydraulic leaks | Batch loss, safety incidents |
| Packaging Lines | Vision systems, cycle count, vibration | Timing drift, mislabeling, misalignment | Quality rejects, warranty claims |
How to choose the first predictive maintenance use case
A simple way to pick the first use case is to rank each option across four factors:
- Downtime cost per hour
- Failure frequency
- Spare-part lead time
- Data availability
If an asset scores high across all four, that’s usually the right place to begin. If it has a high downtime cost but little usable sensor history or messy maintenance logs, don’t jump to modeling yet. Fix the data first.
Here’s why that matters. A precision machining and assembly manufacturer with 300 employees cut its defect rate from 4.2% to 1.1% during a five-month engagement by monitoring machine sensors and tool wear in real time [1]. That led to $720,000 in annual scrap and rework savings [1].
A strong first use case might be one CNC line that already has vibration and load sensors in place, maintenance logs stored in a CMMS with timestamps, and a known failure mode such as spindle bearing wear. That gives you a signal you can track, a cost you can measure, and enough history to train a model. From there, you can feed that use case into Azure for ingestion, scoring, and alert design.
Set up the Azure architecture for data, models, and dashboards
Once you’ve picked the first asset and failure mode, the next job is simple to describe but hard to get right: move from sensor data to alert to work order. The cleanest way to do that is with a small Azure stack, where each service handles one part of the flow.
Core Azure services and their roles
Start by standardizing equipment IDs and log formats so sensor and maintenance data can join without a mess. Azure Data Factory or Fabric Data Factory can then run pipelines that ingest data from different sources, including SQL databases, APIs, and older systems like Siemens Teamcenter or Epicor ERP. Use Bronze, Silver, and Gold layers to move data from raw intake to analysis-ready output.
For streaming data, Fabric Real-Time Intelligence can handle near-real-time anomaly detection. Azure Machine Learning covers model training and deployment. Data Activator works well for simple threshold-based alerts. Dashboards should read from the Gold layer and model scoring outputs so plant teams and leaders see the same picture of asset health.
Model setup: training, scoring, and alert limits
Link failure timestamps to earlier sensor readings, then build features like rolling averages, rate of change, and baseline deviation.
Anomaly detection is a good fit when labeled failure data is sparse. Supervised models like gradient boosting and random forests make more sense when you have enough labeled failures and want to predict a specific outcome, such as bearing failure within a set time window. Alert thresholds shouldn’t be set by model confidence alone. They need to reflect business impact too.
Those scores should then feed dashboards that show what needs action now, not just what already happened.
Dashboard design for plant teams and leaders
One dashboard won’t work for operators, maintenance planners, and plant leadership at the same time. It sounds tidy, but in practice it creates the wrong tradeoffs. The table below shows which metrics and refresh cadence help each group make decisions [2].
| Audience | Primary KPIs | Refresh Cadence | Key Actions |
|---|---|---|---|
| Plant Floor / Operators | Line Status, Hourly Throughput, Active Alerts | Near-Real-Time (5-15 min) | Immediate machine adjustments, defect flagging |
| Maintenance Teams | Asset Health Score, Predicted Failure Risk, RUL | Daily / Shift-based | Work order prioritization, parts ordering |
| Plant Leadership | OEE, Scrap Rates, Maintenance Backlog | Daily / Weekly | Resource allocation, CAPEX planning |
| Executive / VP Ops | Plant-level Risk, Cost per Unit, Inventory Turns | Monthly | Strategic planning, cross-plant benchmarking |
A 2025 case study shows why this foundation work matters. A Tier 2 aerospace components manufacturer started with just 68% critical field accuracy before the data work began. After 16 weeks of data foundation work, 23 automated pipelines, and 340+ data quality checks, that number reached 97.2%. The predictive model entered production 60 days after go-live, and the project produced $420,000 in annual scrap reduction [2].
“The foundation is where the value is created. The AI model just harvests it.” - Ryshe Insights [2]
From there, route only the highest-value alerts into ERP, MES, and service records.
Turn Azure alerts into ERP, MES, and service record actions
Once Azure flags a risk, the next job is simple to say and hard to do: turn that alert into action.
A dashboard by itself doesn’t stop a machine from going down. It matters only when it starts a work order, reserves parts, and helps the plant avoid lost production. That space between seeing a risk and doing something about it is where many predictive maintenance efforts get stuck. Alerts affect outcomes only when they create structured work inside the systems plant teams already use every day.
Integration patterns for work orders, schedules, and maintenance history
Data Activator or Logic Apps can trigger alerts. Power Platform can manage approvals and escalations. Copilot Studio can route service requests and help guide technicians.
When a model flags a risk, a Logic App can create a work order in ERP, reserve the right spare parts, and log the action. At the same time, the MES can shift the production schedule and update equipment status to “Pending Maintenance.” Once the technician finishes the job, the service record can be updated with the actual failure mode, technician notes, and parts used. That completed record then feeds back into the model for retraining.
| Integration Trigger | Target System | Action Taken | Audit Fields |
|---|---|---|---|
| Bearing failure alert | ERP (e.g., SAP, Epicor) | Create work order; reserve spare parts | Asset ID, Severity, Estimated Impact, Timestamp |
| Predicted downtime window | MES (e.g., Hexagon) | Adjust production schedule; update equipment status to “Pending Maintenance” | Schedule Change ID, Affected Work Orders |
| Maintenance task completion | Service records | Log actual failure mode; append technician notes; close loop for model retraining | Technician ID, Actual vs. Predicted Failure, Parts Used |
With that workflow in place, the next step is mapping the fields that keep ERP, MES, and service records in sync.
Data mapping, governance, and closed-loop feedback
Every alert that moves into ERP or MES needs a shared set of fields:
- asset ID
- plant location
- failure mode
- risk score
- recommended action
- timestamp
- model version
If those fields aren’t mapped the right way, downstream systems can’t tie the alert to the correct asset, and the audit trail falls apart.
Shared field definitions also help clear up department-to-department language gaps, like what counts as a “defect” versus a “failure.” The model version field is easy to miss, but it matters. It shows which version of the AI produced a given alert. That becomes important when you’re tracking model drift or explaining a decision during an audit review.
Technician feedback matters just as much. What they found in the field, compared with what the model predicted, along with root cause analysis, gives the next model version better training data. That closed loop is what separates a one-time rollout from a system that keeps getting better over time.
Where Ryshe fits in delivery and plant support
Ryshe supports Azure predictive maintenance delivery through data foundations, ERP/MES integrations, workflow automation, and decision-support dashboards. For ITAR/CUI environments, Quanta adds governance, observability, and append-only audit records for every alert and routing decision.
With the alert loop closed, the next question is whether the program is cutting downtime, scrap, and backlog.
Measure results and expand across plants
Once alerts start driving work orders and service records, the next step is simple: check whether they cut downtime, scrap, and repair time.
KPIs that show business impact
Proving value starts with the right numbers. Focus on unplanned downtime, mean time between failures (MTBF), mean time to repair (MTTR), spare parts usage, scrap rates, and avoided production losses.
Then go one level deeper. Look at whether each alert led to action:
- A work order was opened
- Parts were reserved
- Downtime was avoided
It also helps to track data readiness first. In many plants, required-field accuracy and aligned data definitions get better before ROI shows up in downtime and scrap numbers. That early progress matters because it shows the system is getting cleaner, even if the financial impact hasn’t hit the floor yet.
Those same metrics also act as guardrails when you move to new lines and plants.
How to scale without losing control
Scale only after the first line proves the alert-to-action loop works.
Moving across plants depends on standard data and clear governance. Standardize key fields once - asset ID, model version, and action timestamp - and enforce them centrally across plants. If each site labels things its own way, the whole program gets messy fast.
Use the same alert and maintenance records to retrain the model and watch for drift. Automated data quality checks running at 15-minute intervals help catch model input issues before they hurt alert accuracy as more lines come online [2][3]. Role-based access control (RBAC) and automated audit trails also help reduce dependence on site-specific knowledge as the program grows.
The target at scale doesn’t change: keep alerts accurate, actionable, and tied to execution.
Pilot and scale are different mostly in how tightly data, execution, and governance are standardized.
| Dimension | Pilot Phase | Scale-Out |
|---|---|---|
| Data storage | Siloed databases or Excel | Unified data lake (e.g., OneLake) |
| Integration | Manual exports or one-off APIs | Automated pipelines with CDC (Change Data Capture) |
| Decision making | Human-in-the-loop for every alert | Automated execution within set limits |
| Governance | Site-specific knowledge | Standardized data dictionary and global equipment IDs |
| Model training | Static historical datasets | Continuous retraining via closed-loop feedback |
| Security | Basic user permissions | Role-based access (RBAC) and ITAR/CUI compliance |
Start with one line, connect alerts to execution systems, measure impact, then expand. Pre-built forecasting and anomaly detection accelerators can shorten delivery [4]. Process ownership matters just as much as the tech. Maintenance, operations, IT, and data teams each need clear roles, or the program can stall the moment something breaks.
FAQs
How much data do I need to start?
You don’t need perfect data or a giant multi-year data lake to get started. Start where the model will actually be used. That means focusing on data quality and integration in the specific areas that feed your predictive model.
In most cases, it’s smart to begin with the two or three systems that matter most, often ERP and MES. Clean-enough master data is usually sufficient at this stage. So tackle the core issues first: inconsistent naming, duplicate entries, equipment IDs, and log formats.
Think of it like fixing the labels on your filing cabinets before trying to predict what’s inside them. If names don’t match and records show up twice, the model has a shaky base from day one.
Which Azure services are essential first?
Start with the data layer, not the model.
Set up Microsoft Fabric capacity and OneLake first. Then use Azure Data Factory to build pipelines from your two highest-value sources - usually ERP and MES - so production entities map the same way across systems.
Once that base is in place, add Azure AI Services like Azure OpenAI and custom vision models for alert reasoning and automated workflows.
How do alerts become work orders?
Alerts turn into work orders through automated orchestration between equipment monitoring and your business systems.
When an alert points to a possible failure, an AI agent checks how urgent it is against the production schedule, confirms whether spare parts are in stock, and finds technicians who are qualified for the job.
Power Automate then creates a work order in your maintenance management system with the failure description, needed parts, safety requirements, and the best planned downtime.