Bad weather does not just slow a job down. It can drain $500,000 to $800,000 per year in rework and wasted labor for a mid-size AEC firm.
If I were setting this up, I would keep the plan simple: connect weather forecasts, past weather, and project schedules in Azure, then turn that data into clear field calls. The goal is not more alerts. The goal is better decisions on go/no-go calls, weekly resequencing, delay escalation, and weather-clause records.
Here’s the full article in plain terms:
- I start with the business decisions the system must support
- I set success metrics before buildout, like delay days, stand-down rate, and forecast-to-action time
- I pull in historical weather, live forecasts, and schedule data
- I line up weather records with tasks, trades, shifts, and critical path work
- I use task-based threshold rules for items like crane lifts, concrete pours, roofing, earthwork, and facade work
- I add delay scoring based on forecast confidence, task sensitivity, and schedule impact
- I send results to field, project, and executive views
- I route alerts and approvals through Teams, SharePoint, and Power Automate
- I lock it down with Entra ID, logging, audit trails, and retention rules
- I review false alarms and user adoption so the system stays useful over time
A few numbers stand out. One 200-person AEC firm cut document retrieval time by 74% and saved $480,000 per year after putting AI document tools in place. That same mindset applies here: if I want weather planning to work, I need clean data, clear thresholds, and a record of each decision.
| Area | What the article covers | Main outcome |
|---|---|---|
| Decisions | Go/no-go, look-ahead planning, escalation, clause tracking | Clear ownership and action |
| Data | Forecasts, weather history, schedules, site records | Weather tied to actual work |
| Logic | Task rules plus delay scoring | Fewer bad alerts |
| Delivery | Dashboards and Microsoft 365 workflows | Faster team response |
| Control | Access, logs, audit, retention | Better claim support |
Bottom line: I would build this in order - decisions, data, rules, dashboards, workflows, and governance - so weather data turns into actions the field team can use.
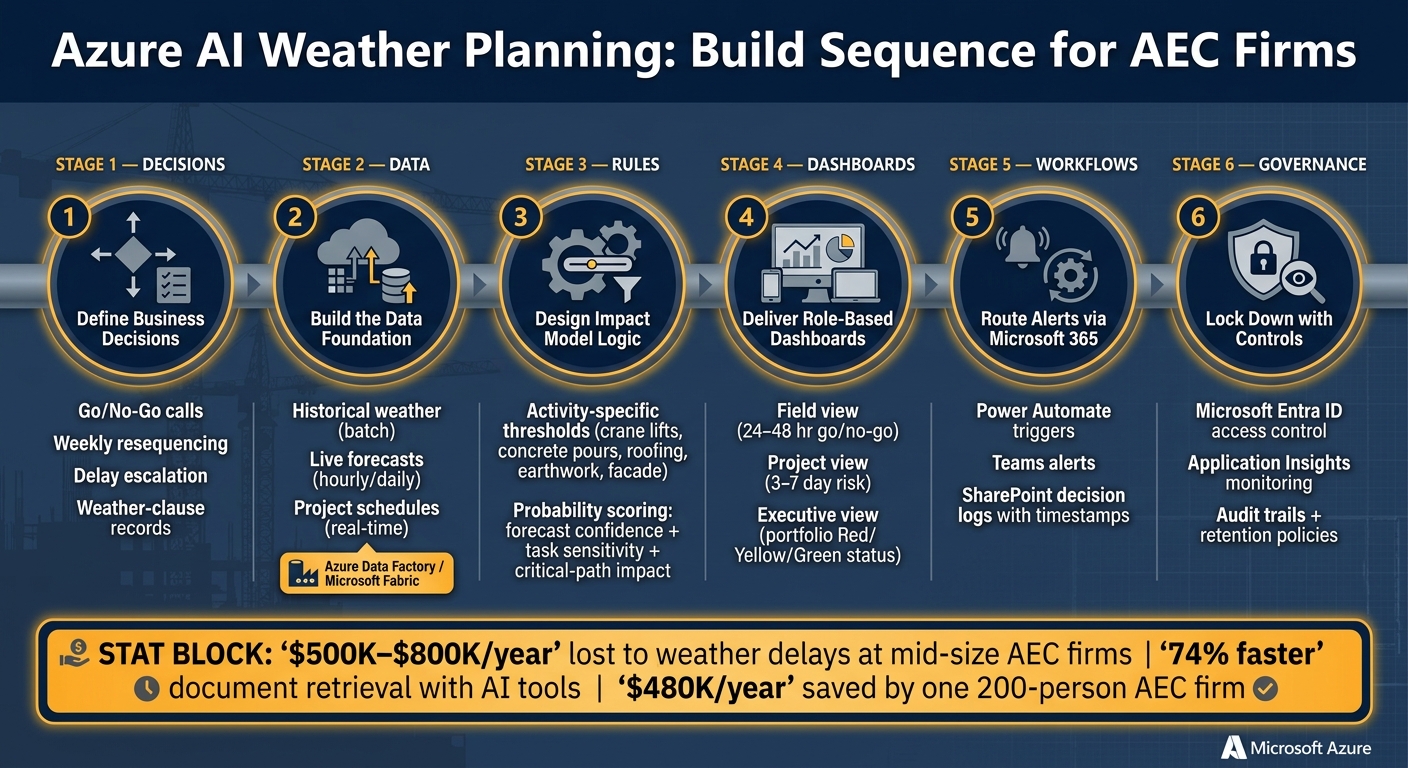
Azure AI Weather Planning Build Sequence for AEC Firms
How AI & satellites are transforming weather forecasting | Microsoft Academic Research Exchange
Build the data foundation in Azure
Start with the data layer. If the schedule data is messy or the site inputs are off, the weather logic falls apart fast.
This workflow needs three inputs:
- historical weather
- live forecasts
- project schedules
Miss one, and the system loses context. It might spot a rainstorm, but it still can’t tell you whether that storm hits a concrete pour on the critical path or just a lower-risk task.
Ingest historical, forecast, and site-specific project data
Each data stream does a different job. Historical weather gives you a site- and month-level baseline. Forecast data helps with near-term field calls. Project data ties both of those to actual activities, crews, and dates.
| Data Input Type | Purpose | Update Frequency | Value to Delay Prediction |
|---|---|---|---|
| Historical Weather | Establishes baseline conditions for site-specific risk analysis | Static / Batch | Defines what counts as an unusual weather event |
| Forecast Weather | Provides short-term triggers for operational adjustments | Hourly / Daily | Drives immediate go/no-go decisions |
| Site-Specific Project Data | Maps weather to WBS activities, work shifts, and critical path | Real-time / Weekly | Contextualizes weather into actual labor and cost impact |
Use Azure Data Factory or Microsoft Fabric to pull data from Procore, Autodesk Construction Cloud, SharePoint, and email into one governed layer [3][1]. Older records can leave holes during ingestion, so run OCR first.
Normalize weather and schedule records for model use
Standardize weather data into hourly intervals, line it up with the schedule, and tag each record by site, time window, trade, and task. That’s the step that lets the model judge whether a weather event hits the work the team is about to do.
Write the normalization rules in code so updates stay steady as schedules move [3]. If a schedule shifts or a new project starts, the mapping should update inside the workflow instead of relying on manual cleanup. That normalized dataset then feeds the weather-impact rules and delay scoring.
Design the weather impact model logic
Once the data is normalized, the model should answer one question: which weather conditions will disrupt which tasks, and how likely is the delay? The job here is simple: connect weather to practical construction AI wins that link schedule impact to field reality.
That matters because the model isn’t just there to spit out alerts. It needs to help with daily field calls, weekly look-ahead planning, and delay-risk escalation. In practice, that keeps the logic tied to the go/no-go, resequencing, and escalation decisions defined earlier.
Use threshold rules tied to construction activities
Generic weather alerts won’t help a superintendent decide whether to mobilize a crane crew. An activity-specific rule will.
What works is a rule tied directly to the task at hand, such as:
- a crane lift
- a concrete pour
- a roofing task
- an earthwork operation
- a facade installation
Each activity has its own trigger point. Concrete pours track temperature. Roofing tracks wind. Earthwork tracks precipitation. Facade work tracks exposure.
Build those thresholds as activity-tagged rules. When a forecast crosses an activity threshold, the model triggers. Those rule hits then become inputs for delay probability.
Add probability scoring for delay likelihood and confidence
Threshold rules catch the obvious cases. Probability scoring handles the gray area - the forecast that points to a possible delay, but not enough certainty for a hard stop.
Score three things:
- forecast confidence
- task sensitivity
- critical-path impact
A critical-path pour with low confidence should not score the same way as a low-impact task with float. That scoring helps separate delay risk from nuisance weather, which cuts down on false alarms.
Use hybrid logic for short-term planning and baseline analysis
One method won’t cover every planning horizon. A hybrid model solves that by splitting the job: forecast signals drive short-term decisions, while historical patterns shape baseline schedule risk during pre-construction and phase planning.
Use forecasts for near-term work. Use historical patterns for preconstruction buffers. Then add rule-based overrides for high-risk activities or contract-sensitive milestones.
Those outputs feed the dashboards and workflows that follow.
Deliver dashboards and Microsoft 365 workflows
Model output only helps when it gets to the right person fast. Dashboards and Microsoft 365 workflows turn weather risk into action. The next step is to tie those outputs to field, project, and executive decisions.
Build dashboards for project, field, and executive views
Each role on a job needs a different slice of the same data. A superintendent making a 5:30 a.m. go/no-go call does not need portfolio-level financial risk. A VP reviewing contingency reserves does not need hourly wind thresholds for one crane lift. Give people the wrong level of detail, and the dashboard becomes noise.
Set up three separate views from the same model output:
| View | Audience | Decisions Supported | Required Detail |
|---|---|---|---|
| Field | Superintendents, Foremen | Daily crew mobilization, safety stand-downs, task sequencing | Hourly risk windows, task IDs, 24–48 hr go/no-go signals |
| Project | Project Managers | Schedule resequencing, RFI/Change Order triggers, subcontractor coordination | 3–7 day risk windows, delay scores, confidence levels, budget impact |
| Executive | Principals, VPs | Portfolio-wide risk, contingency allocation, insurance claims | Delay day estimates, Red/Yellow/Green project health status |
All three views should come from the same model output. What changes is the presentation, not the source. Each one should show affected tasks, risk windows, confidence, and recommended actions.
Route alerts, approvals, and follow-up actions in Microsoft 365
Use Power Automate to send alerts, approvals, and follow-up tasks through Teams and SharePoint. When a threshold or probability score is hit, push the result into Teams and SharePoint for review and action. Log every decision in SharePoint with metadata for audit and claim support.
Use a narrow agent that watches weather-impacted tasks and posts alerts in Teams. Keep that workflow tight so each alert, approval, and action can be traced. Add the decision basis, timestamp, and approver to every alert.
Those logged actions then feed the controlled operating model that follows. Next, lock the workflow down with AI governance and audit controls to ensure compliance.
Run the workflow in production with governance and controls
Dashboards and alerts are only half the job. When the workflow goes live, you need guardrails that protect data, track each decision, and give the team a clear way to make the system better over time.
Apply identity, access, logging, and audit controls
Start with Microsoft Entra ID for single sign-on and project-level access control. Not every user should see every project’s weather risk data, so set permissions by role and project assignment. If your firm works on government contracts, add CUI blocking and PII flags, and auto-append professional liability disclaimers to outputs tied to schedule or engineering estimates[2]. For government work and claims support, these controls should be mandatory.
Log every recommendation with the model version and approval record.
Use Application Insights to watch workflow health and review recommendation and approval trails. Pair that with a retention policy that keeps decision records for contract and insurance requirements.
Build an operating model for continuous improvement
Once those controls are in place, use the audit trail to tune them. Thresholds drift with the season, project type, and field conditions, so assign one owner across IT and project operations to review false positives and retune rules.
Track adoption next to accuracy. If people are ignoring alerts, that’s a signal. You may need to adjust timing, format, or threshold logic so the alerts land better in day-to-day work.
Conclusion: The build sequence for AEC weather planning
Build in this order: decisions, data, rules, dashboards, workflows, and governance. To determine where to begin, find the right AI starting point for your specific operational needs. That order keeps the system tied to actual jobsite decisions and makes it easier to defend when the stakes are high.
FAQs
How much historical weather data should we use?
It depends on what the project needs. There’s no fixed timeline.
Instead of pulling in years of legacy data, start smaller. Bring together the files that matter for one project type first. That makes it much easier to manage data quality and keep things consistent.
Start with a thorough audit of your current data landscape. Then clean up and organize the actual project data you plan to use.
AI output quality depends on input integrity.
What project data matters most for weather planning?
The most important data for weather planning in AEC is site-specific conditions, project schedules, and task-level constraints.
Pull data from tools like Procore, SharePoint, email, and local drives into one source of truth. The goal is simple: give teams one place to see what matters before weather causes trouble.
Key metadata should include:
- project phases
- task deadlines
- responsible parties
- referenced specification sections
With that setup, AI can flag weather-related risks for work like concrete pours and exterior tasks.
How do we reduce false weather alerts?
Reduce false weather alerts by starting with the data itself. A strong foundation built on data quality and governance helps cut down bad signals before they turn into bad alerts.
Use automated checks to flag common issues like:
- Missing values
- Unexpected formats
- Late-arriving data
It also helps to keep clear data lineage. That way, every alert can be traced back to its source instead of feeling like it came out of thin air.
Model training matters too. AI models should learn from clean, validated project data, not raw inputs that haven’t been checked. Ryshe supports this with governed data architectures and production-ready pipelines that include monitoring and error handling.