
If you share one Azure AI hub across teams, quota tracking is not optional. I’d watch four limits first: TPM, PTU, VM family quota, and deployment limits. Those four decide whether a workload runs, slows down, or fails.
Here’s the short version:
- TPM limits shared model throughput for standard deployments.
- PTU gives fixed reserved capacity for steady, high-priority traffic.
- VM family quota limits training, fine-tuning, and other compute-heavy work at the subscription/region level.
- Deployment limits cap how many deployments you can run by resource or region.
If I were running a shared hub, I’d do this:
- Check Foundry → Management center → Quota to find the tight limit.
- Confirm whether the issue is at the hub, project, model, or region level.
- Use Azure Monitor, Log Analytics, and Cost Management to track usage over 24 hours, 7 days, and 30 days.
- Set alerts at 70%–80%, 85%–90%, and 95%.
- Split access between viewers, operators, and approvers.
- Review quota weekly, biweekly, or monthly based on demand.
- Rebalance first. Request more quota only when usage stays high and growth is planned.
A few numbers matter right away. The article points out a sample gpt-4.1 TPM range of 300,000 default TPM and 2,000,000 enterprise TPM, and notes that quota requests can take 1 to 10 business days. That means waiting until a launch week is too late.
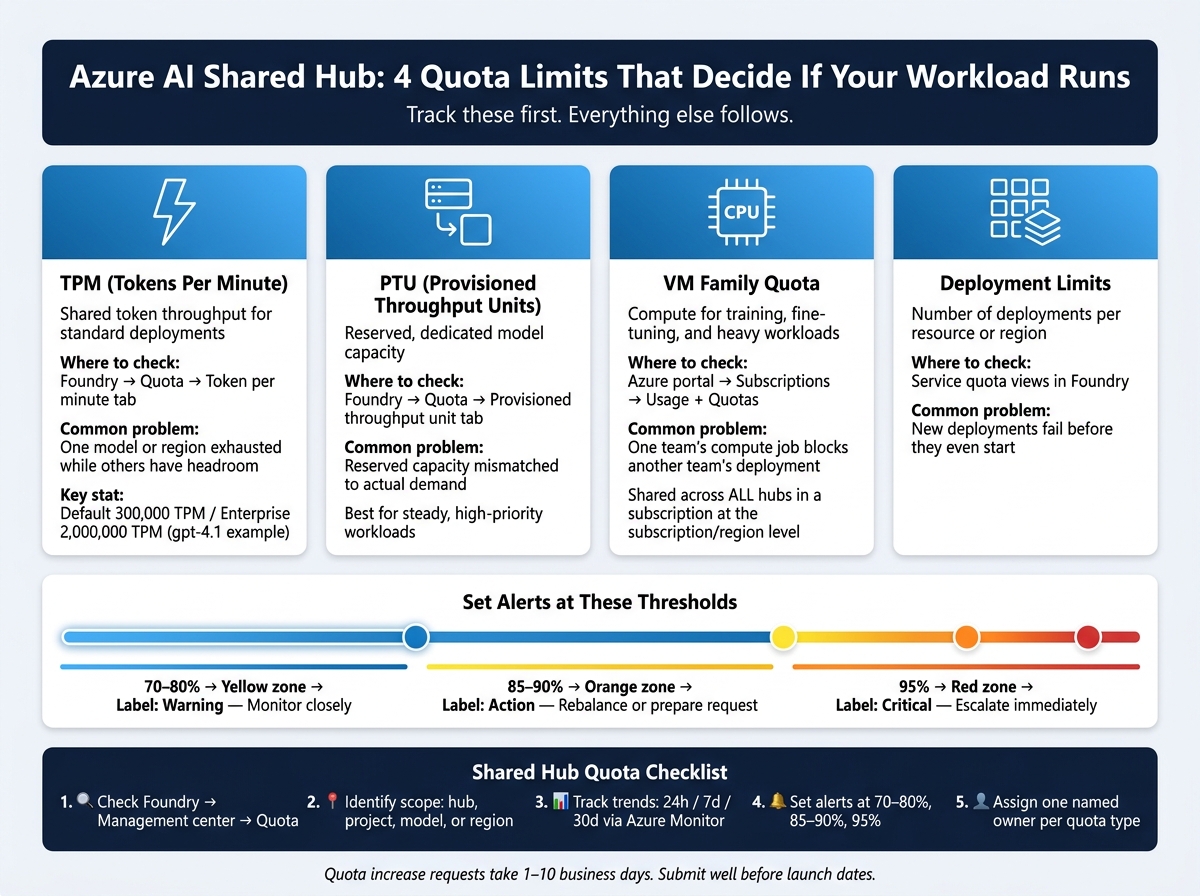
Azure AI Shared Hub: 4 Quota Types You Must Track
Module 8: Manage Quotas, Scaling, Rate Limits, and Cost Footprints for Model Workloads | AI-103
Quick Comparison
| Item | What it limits | Where I’d check it | Common problem |
|---|---|---|---|
| TPM | Shared token throughput | Foundry quota view | One model or region runs out first |
| PTU | Reserved model capacity | Foundry quota view | Reserved capacity is mismatched to demand |
| VM family quota | Compute for training/serving jobs | Azure portal Usage + Quotas | One team’s job blocks another team |
| Deployment limits | Scale by resource/region | Service quota views | New deployments fail before start |
Bottom line: I’d treat quota tracking like part of daily enterprise AI hub management, not a one-time setup. The goal is simple: know the limit, watch the trend, alert early, and assign one owner for each next step.
View Azure AI hub and Azure OpenAI quotas
Start with the hub quota view to spot the bottleneck. Then drill down into Azure OpenAI TPM, PTU, or VM family limits. If you’re trying to see whether usage is drifting toward trouble, Azure Monitor and cost tools are the better fit.
Check hub quota in Azure AI Foundry Management center
Sign in to the Azure AI Foundry portal, pick the shared hub, and open Management center → Quota. Before you look at the totals, check the scope shown in the breadcrumb or header. That part matters more than it seems.
Shared hubs roll up usage across projects, so the page may show hub-wide totals, per-project usage, or region-level allocations based on the filter you choose.
Use Group by to sort by:
- quota type
- region
- model
This is where people often miss the issue. A shared hub can look fine at a glance, while one model family or one region is already maxed out.
Turn on Show all quota to display every quota entry, including items with no current allocation. If an item has no allocation, a new deployment can fail before it even starts.
Review Azure OpenAI TPM and PTU by deployment and region
On the Quota page, the Token per minute tab covers standard deployments. Each deployment pulls from a TPM pool scoped to subscription, region, and model. Within the same subscription and region, total TPM for the same model can’t go past the regional cap. For example, gpt-4.1 shows 300,000 default TPM and 2,000,000 enterprise TPM.[2][1]
The Provisioned throughput unit tab works differently. PTU is reserved, dedicated capacity. Use PTU for steady, high-priority workloads. Use TPM for demand that changes over time or is shared across teams. When you review PTU, make sure the page is showing the metric you need: allocated PTU, consumed PTU, or remaining reserved capacity.
Compare quota types and scope before making changes
A quota increase isn’t always the right fix. Sometimes the smarter move is to move TPM away from an overprovisioned deployment, shift a low-priority workload to a less constrained region, or spread usage across projects a bit more evenly.
Before approving any change, check four things: the quota type, its scope, current usage, and whether the pressure is short-term or baked into normal demand.
| Quota Type | Scope | What It Controls | Where to View It | Common Bottleneck |
|---|---|---|---|---|
| TPM (Tokens Per Minute) | Subscription / Region / Model | Burst throughput for standard deployments | Foundry → Quota → Token per minute tab | One model or region is exhausted while others still have headroom |
| PTU (Provisioned Throughput Units) | Subscription / Region / Deployment | Reserved, dedicated model capacity | Foundry → Quota → Provisioned throughput unit tab | An underused reservation or shift-based demand spike |
| VM Family Quota | Subscription / Region | Compute capacity for training or other heavy workloads | Azure portal → Subscriptions → Usage + Quotas | One team’s compute job can block another team’s deployment |
All hubs in a subscription share the same VM family quota pool.[3] The hub-level Foundry view won’t show that limit, so if compute looks like the bottleneck, check the subscription-level Usage + Quotas page in the Azure portal too.
That cross-check matters: start with the hub view, then move to the subscription view. That’s the right troubleshooting path before anyone sends in a change request.
Once you know the quota type and scope, move to usage trends to see whether the pressure is temporary or structural.
Track usage trends with Azure Monitor, Log Analytics, and Cost Management
Once you know which quota is getting tight, the next job is to watch how fast each workload is using it. Quota limits tell you how much room you have. Usage trends tell you how close you are to trouble.
In a shared hub, that matters a lot. Monitoring helps you see which team, deployment, or region is putting the most pressure on the system. Azure Monitor, Log Analytics, and Cost Management take a one-time quota snapshot and turn it into a live picture of usage across the hub.
Send metrics and diagnostics to a Log Analytics workspace
Azure OpenAI metrics like token counts, request counts, PTU utilization, and latency are collected automatically. You can see them in the Azure portal under Monitoring → Metrics.
For a shared hub, send diagnostics from both the Azure AI hub and each Azure OpenAI resource into one central Log Analytics workspace. That gives you one place to review activity instead of hopping between projects.
Go to each resource and open Monitoring → Diagnostic settings → Add diagnostic setting. Then choose Send to Log Analytics workspace and point it to a workspace owned by the platform or enterprise team, not a single project team.
Turn on AllMetrics and include categories like AzureOpenAIRequestUsage, request/response logs, and audit logs where they exist.
Inside Log Analytics, use KQL to split usage by resource group, tag, application, or business program. This is where tagging discipline pays off. If you use tags like BusinessProgram=AEC and Environment=Production, you can group usage by program and workload without a lot of cleanup later.
Build dashboards for token usage, request volume, and PTU utilization
A simple setup works best here: build three time-based views for three different jobs.
- 24 hours: hourly prompt tokens, completion tokens, and PTU utilization, so operators can shift workloads before throttling begins
- 7 days: daily token totals, peak PTU, and throttling events
- 30 days: Log Analytics token data combined with Azure Cost Management to show estimated USD spend per workload and support monthly budget checks
It helps to organize dashboards by:
- program page
- shared platform summary
- reliability panel showing PTU utilization versus quota and latency trends
Use clear labels and U.S. date formatting so people can read the dashboards fast and not guess what they’re looking at.
Match monitoring type to your reporting needs
No single monitoring method does everything. Metrics are fast, but they don’t go very deep. Logs give you detail, but they cost more to ingest. Cost data tells you the dollar impact, but it usually arrives 24 to 48 hours after the actual usage. So the mix depends on the question you’re trying to answer.
| Monitoring Type | Strengths | Limitations | Typical Delay | Best Use Cases |
|---|---|---|---|---|
| Metrics-based | Near-real-time signals; simple charts and alerts; low cost | Limited detail; aggregated at resource level; doesn’t show who caused a spike | Minutes to near real time | Operations centers, PTU/quota pressure monitoring, SRE views for aerospace and manufacturing production |
| Log-based | Rich per-request detail; KQL analysis by caller, tag, or workload; audit-ready | Higher ingestion volume and cost; requires consistent tagging and schema | Minutes to hours | Compliance reporting, incident investigations, usage attribution in regulated AEC and aerospace programs |
| Cost-based | Direct USD impact; aligns with budgets, chargeback, and financial approvals | Daily granularity; reflects billing cycles, not real-time spikes | Hours to daily | Monthly budget checks, executive reporting, cost optimization across all programs |
A practical way to think about it:
Use metrics for live alerts, logs for root-cause analysis, and cost data for monthly reporting.
With usage trends in place, the next step is alerting and ownership.
Set alerts and assign ownership for shared quota management
Usage signals tell you what’s happening. Alerts and clear ownership decide what happens next.
Dashboards and logs are useful, but they don’t do much on their own. Once shared quota starts getting tight, teams need clear thresholds, named responders, and a simple path for action.
Create alerts for quota pressure and abnormal usage spikes
Use three thresholds:
- 70% to 80% for warning
- 85% to 90% for action
- 95% for critical
For PTU deployments, track utilization with the PTU utilization metric: PTUs consumed ÷ PTUs deployed [4].
For cross-team patterns, such as one program using an outsized share of tokens or a burst of failed requests across several deployments, add KQL-based log alerts in Log Analytics. Use metric alerts for immediate paging or chat notifications. Use KQL alerts when the issue looks systemic and needs investigation and escalation.
Every alert should include:
- hub name
- affected deployment
- severity level
- timestamp
- on-call contact or approval queue
That last part matters. During an incident, responders shouldn’t waste time hunting for the right owner.
Use RBAC roles to separate viewers, operators, and approvers
A clean split across three access levels keeps quota management accountable without turning it into red tape.
Viewers need read access to monitoring resources and the hub. Operators need enough access to investigate metrics and manage alerting or diagnostic settings. Approvers should be a smaller group with authority over quota increase requests and policy exceptions.
Keep viewers, operators, and approvers separate so detection and approval don’t sit with the same person.
In practice, the central platform team owns the shared infrastructure, alert setup, and first-response triage. Program owners forecast demand and pause lower-priority jobs when quota gets tight. Bring in FinOps only when sustained demand calls for budget or procurement action.
Choose a central or distributed ownership model
For a shared hub, ownership should match how often teams compete for capacity. The right model depends on how predictable each program’s demand is and how much cross-team contention the hub sees.
Use central ownership for shared, contested capacity. Use distributed ownership only for stable, isolated workloads.
| Dimension | Central Shared-Services | Distributed Program Ownership |
|---|---|---|
| Responsiveness | Slower; requires central triage | Faster; program teams act on their own limits |
| Control | High; one team enforces the shared framework | Lower; one program can exhaust shared capacity |
| Best Fit | Shared hub with variable demand across teams | Isolated project-specific deployments |
For most AEC, manufacturing, and aerospace programs running on a shared hub, a hybrid approach is the most practical. The central platform team owns the quota framework, alert thresholds, and approval workflow. Program owners handle day-to-day consumption within preapproved boundaries and escalate when they need more.
The policy should name monitors, approvers, response times, and escalation thresholds. Put that policy directly into the runbook: who monitors, who approves, response times, and escalation thresholds.
Then use that policy as the input to the quota review cadence that follows.
Run a quota review and adjustment workflow for production hubs
With monitoring, alerts, and ownership already in place, the last piece is a repeatable review and adjustment process. A fixed routine stops quota management from turning into a fire drill. It also helps keep model, compute, and service quotas lined up across teams.
Set a review cadence based on workload activity
Pick the review frequency based on how much the workload changes.
- Weekly reviews fit fast-moving copilots, where prompt patterns and user adoption can shift fast.
- Biweekly reviews make sense during active expansion phases.
- Monthly reviews fit stable, mature workloads with a predictable, fixed user base.
At each review, look at three inputs: current quota, recent usage, and monthly cost. Alerts from the prior section start the review; the review then drives the action. Put the cadence in the runbook and keep it on a recurring calendar invite.
Use that rhythm to decide whether to rebalance, request more quota, or hold steady.
Rebalance deployments or request increases with a documented approval path
Once a review shows a constraint, move straight to a rebalance-or-request decision. Check whether the pressure is limited to one deployment or spread across the hub, whether unused capacity exists elsewhere, and whether demand is temporary or persistent.
If one deployment is saturated while another keeps showing headroom, rebalance first by moving TPM, PTU, or compute capacity from lower-use deployments. If most major deployments are running above 80% utilization, or growth is tied to a planned rollout, request a quota increase through Foundry’s Request quota action [7][6]. Build in 1 to 10 business days for approval, so requests should go in well before a critical launch date [5].
Use a short approval note that includes utilization, forecast demand, and expected cost impact. Operators gather the data. Approvers decide on increases or exceptions. Define approval tiers in a RACI matrix: this helps maintain AI governance for regulated industries where audit trails are mandatory. operational lead approval for cost-neutral rebalancing, and director plus finance approval for increases above a set USD amount.
Every decision - rebalance, increase, or no change - should be logged with the review date in MM/DD/YYYY format, participants, workloads covered, utilization metrics, USD costs, and change details. Link each log entry to the Azure Monitor workbook or Log Analytics query used in the analysis.
Conclusion: Running a reliable shared Azure AI hub
Running a reliable shared Azure AI hub comes down to five habits done the same way every time: define quota scope clearly for each hub, use Azure AI Foundry quota views to see the current state, trend usage with Azure Monitor and Log Analytics, alert before capacity becomes a delivery risk, and assign named owners with a fixed review cadence. These steps depend on each other. Visibility without ownership turns into ignored dashboards. Alerts without a review routine turn into reactive firefighting.
FAQs
How do I tell whether a quota issue is at the hub, project, model, or region level?
Check Azure AI Foundry and Application Insights by layer:
- Hub: if multiple projects are seeing access denials, the problem may sit at the hub level.
- Project: if only one team or workspace is affected, focus on that project.
- Model: if one model is being throttled while others still work, look at model-level limits.
- Region: if deployment fails because of local capacity, the issue may be tied to the region.
Application Insights can help confirm whether you’re dealing with service-side rate limiting or a project configuration limit.
When should I rebalance TPM or PTU instead of requesting more quota?
Rebalance TPM or PTUs when demand is steady, easy to forecast, and still fits within your current total capacity. This works well when you need to shift capacity between models or workloads to get better performance.
Request more quota only when total demand keeps going past your provisioned capacity, and rebalancing no longer supports the performance needs of critical workflows.
What is the best alerting and ownership model for a shared Azure AI hub?
The best setup blends central oversight with clear ownership for each asset.
Use a data catalog to record who owns each dataset and who’s responsible for it. Then manage access with role-based controls, and use a central admin console with usage analytics to see how data is being used across departments.
It also helps to set automated alerts for key thresholds, like quota limits that are getting close or deadlines that are about to expire.
Use Application Insights for audit trails, rate limiting, and real-time monitoring.